Inverted Yield Curve
The Federal Reserve, interest rates, and inflation have been big topics this year. Chatter about a possible recession has been part of the conversation, too.
A few weeks ago, we looked at the enormous amount of stimulus cash that remains in savings, which is cash that could support spending and delay the start of a recession. It’s an analysis that went against the grain of the consensus. But the stash of cash could eventually dry up.
An inversion of the 10-year Treasury yield and the 3-month T-bill foreshadowed eight of the last nine recessions.
We must travel all the way back to 1966, when an inversion presaged a sharp slowdown in economic growth, but a recession did not ensue.
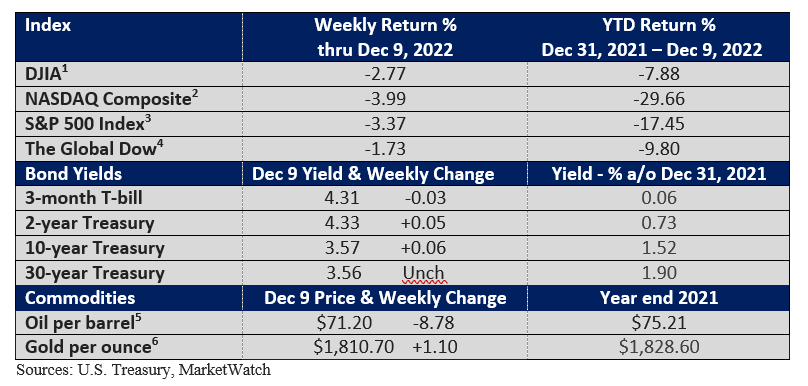
What is an inverted yield curve? An inversion occurs when longer-dated maturities yield less than shorter-dated maturities. Today, the 10-year Treasury yields less than the 3-month T-bill, as highlighted above in the table of returns.
It doesn’t happen often (recessions don’t happen often), but it suggests that investors believe short-term rates are headed lower. Maybe not today, but weaker economic conditions would be expected to force the Fed to cut rates.
When that has happened in the past, short yields fall faster than longer yields, and the curve normalizes. Note the graphic below. It illustrates the predictive ability of the yield curve.
While it has been a reliable predictor, it has not done a good job of pinpointing the start of a recession.
According to ITR’s chief economist Brian Beaulieu, the adversity predicted by the inverse yield curve is not immediate. Historically, it takes a median of 14 months for the US Total Industrial Production 12 month moving average data trend to reach a peak following the onset of the inversion. In this case, the inversion appeared in October 2022. Add 14 months and you get the typical timing input of December 2023 for when the US Total Industrial Production 12 month moving average data trend will peak. It is worth noting that the median input of 14 months is quite variable, with 5 to 18 months being normal.
There were no instances of a recession occurring without a yield curve inversion. The curve inverted in October.
We are watching things closely along with our friends at ITR Economics. We will make adjustments in our portfolios as time progresses.
If you have any questions or would like to discuss any other matters, please let me know.
Clark S. Bellin, CIMA®, CPWA®, CEPA
President & Financial Advisor, Bellwether Wealth
402-476-8844 cbellin@bellww.com
All items discussed in this report are for informational purposes only, are not advice of any kind, and are not intended as a solicitation to buy, hold, or sell any securities. Nothing contained herein constitutes tax, legal, insurance, or investment advice. Please consult the appropriate professional regarding your individual circumstance.
Stocks and bonds and commodities are not FDIC insured and can fall in value, and any investment information, securities and commodities mentioned in this report may not be suitable for everyone.
U.S. Treasury bonds and Treasury bills are guaranteed by the U.S. government and, if held to maturity, offer a fixed rate of return and guaranteed principal value. U.S. government bonds are issued and guaranteed as to the timely payment of principal and interest by the federal government. Treasury bills are certificates reflecting short-term (less than one year) obligations of the U.S. government.
Past performance is not a guarantee of future results.
Different investments involve different degrees of risk, and there can be no assurance that the future performance of any investment, security, commodity or investment strategy that is referenced will be profitable or be suitable for your portfolio.
The information has been obtained from sources considered to be reliable, but we do not guarantee that the foregoing material is accurate or complete. The information contained in this report does not purport to be a complete description of the securities, markets, or developments referred to in this material.
The information contained is not a complete summary or statement of all available data necessary for making an investment decision and does not constitute a recommendation.
Before making any investments or making any type of investment decision, please consult with your financial advisor and determine how a security may fit into your investment portfolio, how a decision may affect your financial position and how it may impact your financial goals.
All opinions are subject to change without notice in response to changing market and/or economic conditions.
1 The Dow Jones Industrial Average is an unmanaged index of 30 major companies which cannot be invested into directly. Past performance does not guarantee future results.
2 The NASDAQ Composite is an unmanaged index of companies which cannot be invested into directly. Past performance does not guarantee future results.
3 The S&P 500 Index is an unmanaged index of 500 larger companies which cannot be invested into directly. Past performance does not guarantee future results.
4 The Global Dow is an unmanaged index composed of stocks of 150 top companies. It cannot be invested into directly. Past performance does not guarantee future results.
5 CME Group front-month contract; Prices can and do vary; past performance does not guarantee future results.
6 CME Group continuous contract; Prices can and do vary; past performance does not guarantee future results.


